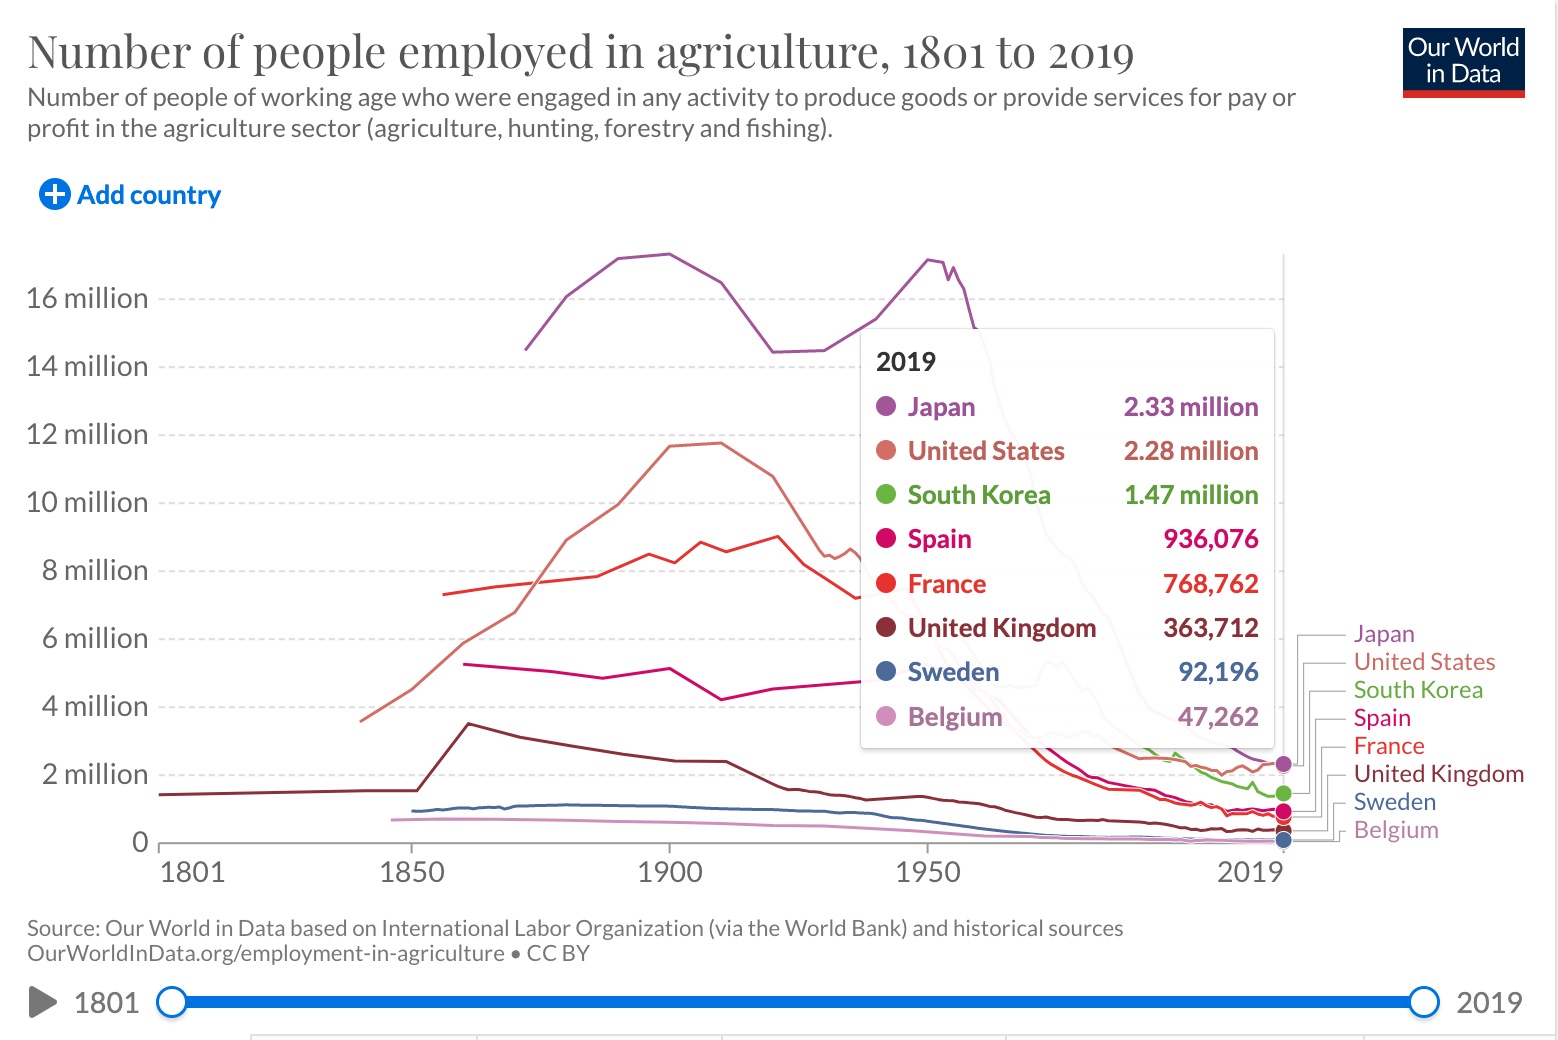
I downloaded the \(Employment\) in Agriculture data from Our World in Data. I chose to analyze this data because as someone in the agriculture business I am interested in the employment data in different countries.
This is the link to the data.
The following code chunk loads the package I will use to read in and prepare the data for analysis
- Read data in
- Use glimpse to see the names and types of the columns
glimpse(number_of_people_employed_in_agriculture)
Rows: 7,290
Columns: 4
$ Entity               <chr> "Afghanistan", "Afghanistan", "Afghanis…
$ Code                 <chr> "AFG", "AFG", "AFG", "AFG", "AFG", "AFG…
$ Year                 <dbl> 1991, 1992, 1993, 1994, 1995, 1996, 199…
$ number_employed_agri <dbl> 2092348, 2296014, 2542180, 2750005, 291…
#(number_of_people_employed_in_agriculture)
- Use output from glimpse (and View) to prepare the data for analysis
Create the object
regionsthat is list of regions I want to extract from the datasetChange the name of 1st column to Region and the 4th column to People employed
Use filter to extract the rows that I want to keep: Year >= 1900 and Region in region
Select the columns to keep: Region, Year, People employed
Use mutate to convert People Employed to millions
Assign the output to
number_of_people_employed_in_agricultureDisplay the first 10 rows of
number_of_people_employed_in_agriculture
regions <- c("Japan",
             "United States",
             "South Korea",
             "Spain",
             "France",
             "United Kingdom",
             "Sweden",
             "Belgium")

number_of_people_employed_in_agriculture <- number_of_people_employed_in_agriculture %>%
  rename(Region = 1, Employed = 4) %>%
  filter(Year >= 1900, Region %in% regions) %>%
  select(Region, Year, Employed) %>%
  mutate(Employed = Employed * 1e-6)

number_of_people_employed_in_agriculture
# A tibble: 571 × 3
   Region   Year Employed
   <chr>   <dbl>    <dbl>
 1 Belgium  1900    0.616
 2 Belgium  1910    0.585
 3 Belgium  1920    0.525
 4 Belgium  1930    0.505
 5 Belgium  1947    0.364
 6 Belgium  1961    0.213
 7 Belgium  1970    0.197
 8 Belgium  1971    0.184
 9 Belgium  1972    0.173
10 Belgium  1973    0.165
# … with 561 more rows
Check that the total for 2019 equals the total in the graph
number_of_people_employed_in_agriculture %>% filter(Year== 2019) %>%
  summarise(total_emm = sum(Employed))
# A tibble: 1 × 1
  total_emm
      <dbl>
1      8.28
Add a picture
Write the data to file in the project directory
write_csv(number_of_people_employed_in_agriculture, file = "number_of_people_employed_in_agriculture.csv")